

This is the result from last weeks analysis by mentors at my forex mentor program. Experienced forex trader & trainer, Pierre Du Plessis shared his analysis at the beginning of the week, followed by updates in the members only forum. Here he reviews what happened, good and bad, in his own inimitable style 🙂
 What a week we had!!
We had plenty of pips on the table with some the big winners for the week being the Euro/GBP with 90 pips, the Euro/JPY at 175 pips, the GBP/Dollar with 200 pips and the first price this week must be the GBP/ JPY giving a stunning 300 pip move.
Best part of it all…….the mentors at Forex Mentor Pro showed you where to look for these moves BEFORE IT HAPPENED!! Yes mates – before, not after the moves like most of our internet based competitors do.
Stick with us……..we might just make you famous – maybe rich too 🙂
Fridays catch – up:
Sometimes I will refer to `the mother in law` in my video`s. The mother in law represents the 200 EMA on that specific time frame.
……………………………………………………………………………………………..
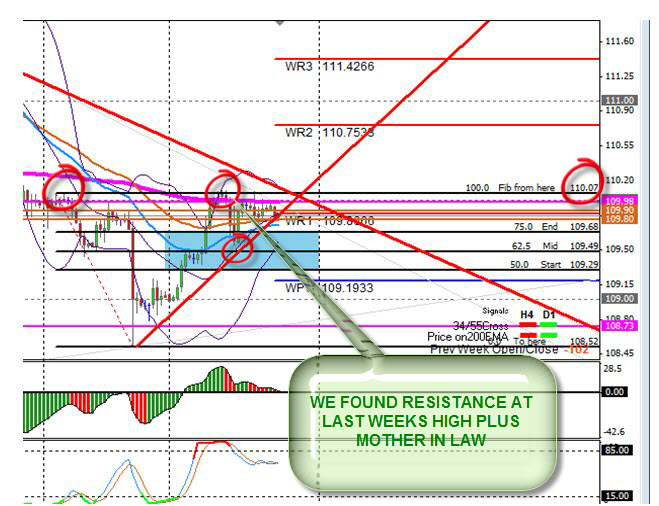
1) Euro Index on the 4 hour chart:
Price is under the 200 EMA
34 EMA (sky) is under the 55 EMA (earth)
Direction: Short
Potential trading zone: 109.29 to 109.68
Potential area to look for reaction: 109.49 and 109.72
Potential Profit take areas: The 109.00 and 108.68 level.
MACDEE Divergence: No
Stochastic: Overbought
Did we open with a GAP? No
Potential Counter Trades: The 108.68 and 108.30 levels.
Notes: Price is currently in the zone to look for shorts. If we do break to the upside however, take note of the 200 EMA and weekly pivot at and 55 EMA`S BETWEEN 109.72 and 110.00 area for a roadblock that can give price resistance.
Friday`s notes: Price did break the trading zone as mentioned and found resistance at the mother in law at the psychological level of 110.00. From here we had a short that gave almost 50 pips. Looking at the charts this morning we can clearly see that we trapped in a triangle – but that is next week’s problem as we as mentors don’t trade on a Friday.
euro index
……………………………………………………………………………………………..
2) Euro/USD on the 4 hour chart:
Price is under the 200 EMA
34 EMA (sky) is under the 55 EMA (earth)
Direction: Short
Potential trading zone: 1.3421 and 1.3485
Potential area to look for reaction: 1.3453 and 1.3489 levels.
Potential Profit take areas: The 1.3305 level
Stochastic: No man’s land
MACDEE Divergence: No
Did we open with a GAP? No
Potential Counter Trades: The 1.3305 level.
Notes: By the looks of it, price found resistance at the 50% fib at 1.3421. However I would prefer a bigger pull back to at least the 1.3453 and 1.3489 levels.
Fridays notes: Yesterday price came up to my preferred 1.3484/1.3500 level. Price gave us a short for about 50 pips before we had a ^&%$# pull back again that kicked my 2nd part of my trade out. I was expecting a bigger drop – but this morning I can clearly see why price is slowing down. Like the Euro Index price is trapped in a triangle!
……………………………………………………………………………………………..
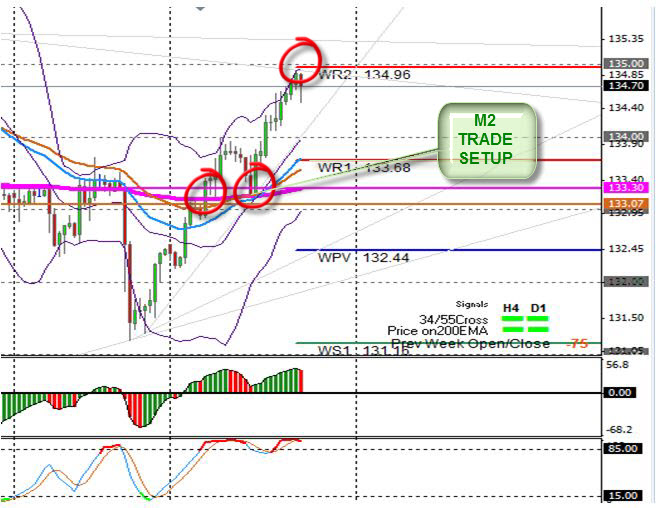
3) Euro/JPY on the 4 hour chart:
Notes: The 34/55/200 EMA Indi is mixed. Price is currently above the 200 EMA but 34/55 stack to look for shorts. We have overbought stochastic. Best will be, if you want to trade this pair, to keep your eyes on the 132.91 level. Price needs to break that level first to the downside before any shorts can be considered.
Other possibility – to look at the 133.68 level where we have a weekly pivot. If we look to the left of the chart we can see this level is also previous resistance for a possible area to short again back down to all the EMA`S at 133.15. If this levels breaks to the upside……a possible M2 trade going long can set up for a run back up to 134.96 where we have previous resistance and a weekly 2nd pivot point. This area will also be a strong area to look for shorts.
Fridays Notes: This was a stunning M2 trade that set up this week. Price broke the mother in law 200 EMA to the upside…….pulled back to the 133.30 level where after we had a good run of a 170 odd pips. Where did price stop this morning? Drum roll please – the 134.96 level!!! How was that for a spot on analysis on Tuesday?
……………………………………………………………………………………………..
4) Euro/GBP on the 4 hour chart:
Price is under the 200 EMA
34 EMA (sky) is under the 55 EMA (earth)
Direction: Short
Potential trading zone: 0.8386 and 0.8430
Potential area to look for reaction: The 0.8400/09 level
Potential Profit take areas: The 0.8300 level
MACDEE Divergence: No
Stochastic: Overbought
Did we open with a GAP? No
Potential Counter Trades: The 0.8300 and 0.8265 levels.
Notes: If we do break the zone for some reason to the upside – take note of all the EMA`S at 0.8454 that can form the next roadblock where price can find resistance and as an area for possible shorts.
Friday’s notes: This was my trade for the week. Price did break the trading zone but found resistance at the 0.8454 I mentioned on Tuesday. This trade was a stunning mother in law short taking price all the way down to my profit take at 0.8370 where we have the main weekly mid pivot. This trade gave 80 odd pips.

……………………………………………………………………………………………..
5) GBP/USD on the 4 hour chart:
Notes: Price is trapped in a triangle. Currently we are sitting on the daily 55 EMA at the bull trend line. With an overbought stochastic so we can expect price to move back up again. If the trend line breaks and the 55 EMA at 1.5971 to the downside, possible M2 shorts can be on the cards.
Fridays Notes: Price did break the bull trend line as mentioned giving as an opportunity to short. This trade tumbled for 50 odd pips before the WS1 pivot and MS1 pivot at 1.5870 gave support.
Stochastic was oversold at this stage and. Marc warned us to be careful on Wednesday with this pair as there where red flag news coming up in the morning! What did price do after the news…….We $^&%$&* reached for the stars by moving over 200 pips back up over 2 days.

……………………………………………………………………………………………..
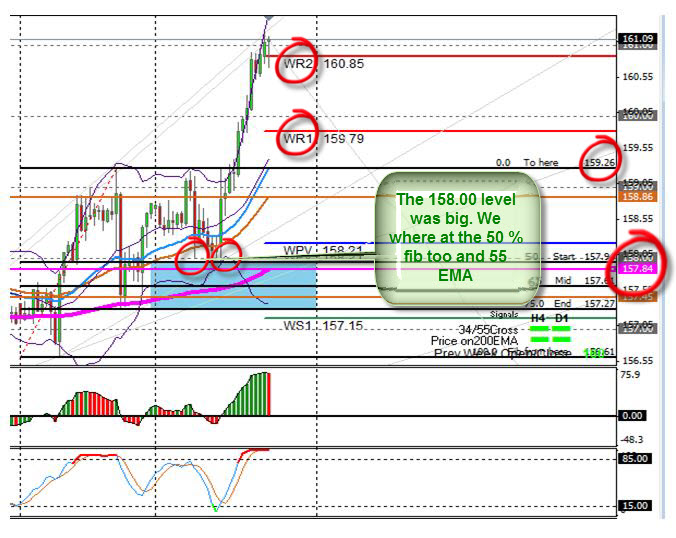
6) GBP/JPY on the 4 hour chart:
Price is above the 200 EMA
34 EMA (sky) is above the 55 EMA (earth)
Direction: Long
Potential trading zone: 157.94 to 157.29
Potential area to look for reaction: The 158.15 level we have the 55 EMA and weekly main pivot waiting with the psychological of 158.00 level just under it at the 50% fib area.
Potential Profit take areas: The 159.00 level
MACDEE Divergence: No
Stochastic: No man’s land
Did we open with a GAP? No
Potential Counter Trades: The 159.26 level is big. This is a resistance level now for many weeks.
Notes: If price do break the 158.00 level to the downside, price can drop to 157.52 where we have the mother in law waiting in the zone.
Fridays notes: What a stunning earth and sky trade this week? Price came down to the 158.00 level where we found support twice this week. The second bounce with the help of Wednesday’s news took this pair flying breaking previous resistance at 159.26 and WR1 pivot at 159.79……..even going as high as WR2 and psychological level at 161.00!! THIS TRADE GAVE OVER 300 PIPS!!!
……………………………………………………………………………………………..
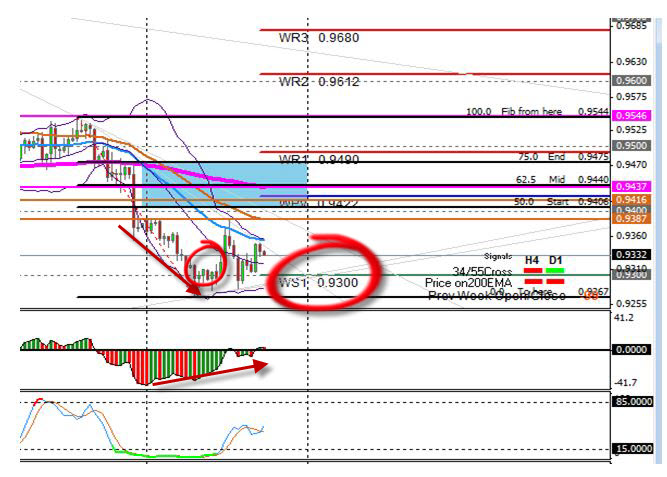
7) AUD/Dollar on the 4 hour chart:
Price is under the 200 EMA
34 EMA (sky) is under the 55 EMA (earth)
Direction: Short
Potential trading zone: 0.9435 to 0.9490
Potential area to look for reaction: The 0.9427 and 0.9453 levels.
Potential Profit take areas: The 0.9333 and 0.9300 levels
Stochastic: Oversold
MACDEE Divergence: Yes
Did we open with a GAP? No
Possible Counter Trade: The 0.9300 level.
Notes: If we make new lows follow it with the fib to get the new potential trading zone.
Fridays Notes: Early in the week we didn’t get a pullback as expected – but price instead made new lows on Tuesday…..so we had to follow price to get the new trading zone for the week that started now at 0.9408.
Price found nice support at the psychological level and WR1 pivot at 0.9300 giving an opportunity to counter long…..This trade gave 90 pips…..HOWEVER even with this move up; price still didn’t make it to the preferred zone to look for shorts this week
……………………………………………………………………………………………..
8) AUD/JPY on the DAILY chart:
Price is above the 200 EMA
34 EMA (sky) is above the 55 EMA (earth)
Direction: Long
Potential trading zone: 93.19 to 91.96
Potential area to look for reaction: The 92.74 and 92.44 levels.
Potential Profit take areas: The 94.00 and 95.00 and 95.53 levels.
Stochastic: No man’s land
MACDEE Divergence: No
Did we open with a GAP? No
Potential Counter Trades: The 94.00 and 95.00 and 95.78 levels
Notes: Price is currently in the zone to look for longs on the daily chart with the bull trend line keeping price up. If the trend line breaks to the down side, all longs are of the table as we can have a M2 short setting up for a possible drop down to MS1 pivot.
Friday’s notes: Price did find support at that bull trend line at the mother in law at 92.44 I mentioned on Tuesday. Price jumped from here 130 pips and got very close to the first profit take at 94.00.
…………………………………………………………………………………………….
9) USD/CHF on the 4 hour chart:
Price is under the 200 EMA
34 EMA (sky) is under the 55 EMA (earth)
Direction: Long
Potential trading zone: 0.9171 to 0.9132
Potential area to look for reaction: The 0.9132 level
Potential Profit take areas: The 0.9250 level
Stochastic: No man’s land
MACDEE Divergence: No
Did we open with a GAP? No
Potential Counter Trades: The 0.9250 is a big level as we have the daily 200 EMA waiting there.
Notes: If price do break the 55 EMA for some reason at 0.9132 to the downside……take note of the 200 EMA at 0.9097 for the next road block
Fridays Notes: Price did find support at that level I mentioned on Tuesday morning at 0.9132. Here we had the WS1 pivot in place and if we look to the left of the chart…prev. support resistance areas. We could squeeze only 50 pips out of this one as price got stopped by the weekly main pivot at 0.9190.
Like the Euro Dollar pair, we can clearly see this morning we trapped in a triangle!!
……………………………………………………………………………………………..
10) USD/JPY on the 4 hour chart:
Price is above the 200 EMA
34 EMA (sky) is above the 55 EMA (earth)
Direction: Long
Potential trading zone: The 98.65 to 98.12 level
Potential area to look for reaction: 98.75/65 and 98.41 levels.
Potential Profit take areas: The 99.42/61 and 99.88 levels
Stochastic: Overbought
MACDEE Divergence: No
Did we open with a GAP? No
Potential Counter Trades: The 99.88 level
Notes: If price makes new highs, follow it with your fib to get the new potential trading zone.
Fridays Notes: Price did make new highs this week without a descend pull back. Instead we reach for the starts and currently sitting at a very high level just on the other side of the 99.88 WR1 pivot level. ….but that’s next week’s problem
……………………………………………………………………………………………..
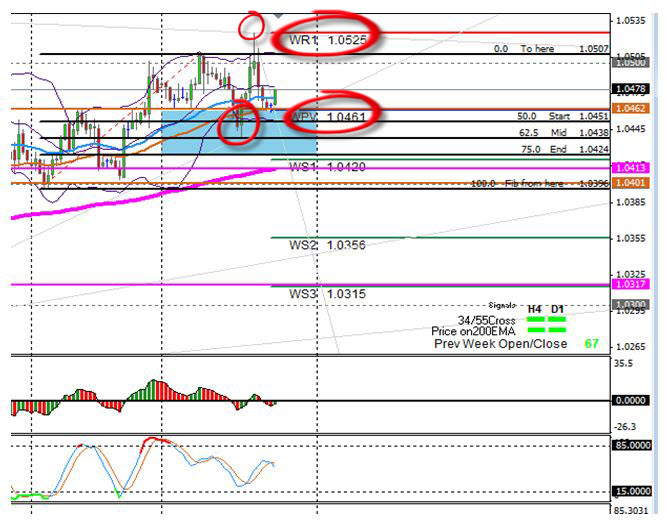
11) USD/CAD on the 4 hour chart:
Price is above 200 EMA
34 EMA (sky) is above the 55 EMA (earth)
Direction: Long
Potential trading zone: 1.0450 to 1.0423
Potential area to look for reaction: The 1.0446 level
Potential Profit take areas: The 1.0480 level and 1.0500
Stochastic: No man’s land
MACDEE Divergence: No
Did we open with a GAP? No
Potential Counter Trades: The 1.0500 and 1.0525 levels
Notes: Possible triple top at 1.0500 for the week. If price for some reason do break the 55 EMA at 1.0446 be careful as price can drop to the mother in law at 1.0393
Friday’s notes: Price did pull back in to the zone and gave an opportunity to go long. This trade gave 60 odd pips after confirmation on the smaller time frames…….Where did price stop? Drum roll please! Price got to that triple top area I mentioned at 1.0525 where we also had a weekly and monthly pivot before price crashed down 60 odd pips once again
……………………………………………………………………………………………..
12) USD Index on the 4 hour chart:
Price is above the 200 EMA
34 EMA (sky) is above the 55 EMA (earth)
Direction: Long
Potential trading zone: 80.91 to 80.63
Potential area to look for reaction: The 80.64/55 level.
Potential Profit take areas: The 81.24 and 81.45 level
Stochastic: No man’s land
MACDEE Divergence: No
Did we open with a GAP? No
Potential Counter Trade: The 81.24/45 levels.
Notes: Price is at a big important level. We are at the daily mother in law 200 EMA at 81.24 and if we look to the left of the chart, big previous support resistance too. This level will be key this week.
Fridays notes: That big daily mother in law mentioned on Tuesday did hold……price moved down in to the zone where we had an opportunity to go long again at 80.77……but this move was limited to only 40 pips. IT’S ALMOST IF THERE IS NOW VOLUME/MOMENTUM behind this pair at the moment.
……………………………………………………………………………………………..
Please remember we are NOT a “tipping service.” What we aim to teach you here at fxmentorpro is how to look for trades for yourself using different methods, taking your trading to the next level.
Have a good one mates
Pierre 😛
`Every new day begins with possibilities`
Pierre Du Plessis is one of the experienced mentors who provide education and analysis on a daily basis from our site : www.forexmentorpro.com
If you would like to test drive it for just $1 CLICK HERE
0 Comments
Trackbacks/Pingbacks