


This is an example of the results that members of my forex mentor program are able to enjoy whilst trading with full time trader, Pierre Du Plessis, in our members only forum. As with all the mentors he posts his detailed analysis at the start of the week. What he is looking to trade and why. He then updates members during the week and offers feedback, tips and advice.
 This was a difficult trading week and yet Pierre still managed to bank over 100 pips which he does on a regular basis.
Below he shows you, in his own inimitable style, the results of his analysis, good and bad.
Remember NO trader wins all of the time. Some traders that I know only win 30% of the time and yet because of their strategy and trade management are still highly profitable.
This is Pierre’s update which he titled
“Give That Man a Pint of Beer”
Morning all.
Hope you are all well……..It’s a bank holiday here in South Africa today – and I am working 😳
On Tuesday morning I said…………..
`By now you know I use the Euro Index and Dollar Index as extra information and confirmation when we trade the 10 pairs Marc and I look at.
Looking at the bigger time frames on these two indices, we can clearly see we are hitting very important levels here mates. 😕
Read my notes in my write up……drop to the higher time frames and see if you can spot the danger ahead?
I am expecting bigger pullbacks that will drag the other pairs with it…..so take note of the danger, the correlation and most important – TAKE CARE !`
Oh boy – that was so spot on………let’s see if I deserve a drink after this week’s trading.
……………………………………………………………………………………
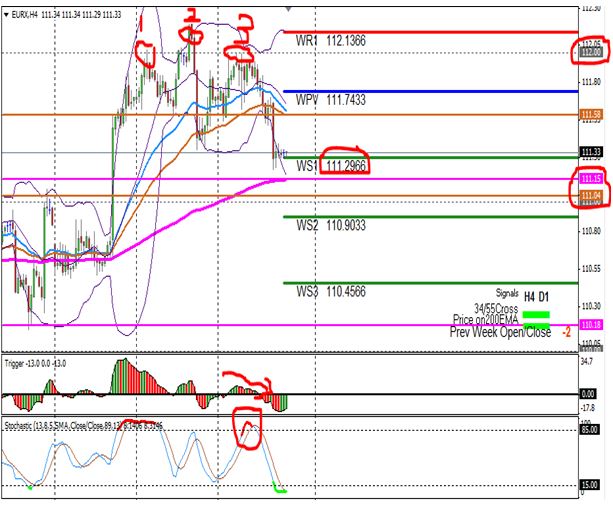
1) Euro Index on the 4 hour chart:
Notes: I am sitting on my hand a little bit here mates. Last week we closed min 2 pips lower than last week’s opening price…giving us almost a doji candle on the weekly chart……..The 112.00 is a big resistance level if you stick to the weekly chart…..dropping to the daily chart we can see we also have a MR2 pivot at this level with MACDEE divergence showing up and overbought stoch too.
Now in my book it’s all tell tell signs to be careful with longs at the moment as we might have a deeper pullback on the cards.
Fridays notes:
Oh boy how right was I, give that man a coke 🙂
Price did find resistance at that 112.00 level I mentioned and after making a triple top at this level went south for almost 80 pips. I spot now a roadblock at 111.29/15/04 so be careful if you are still in a short.
……………………………………………………………………………………………..
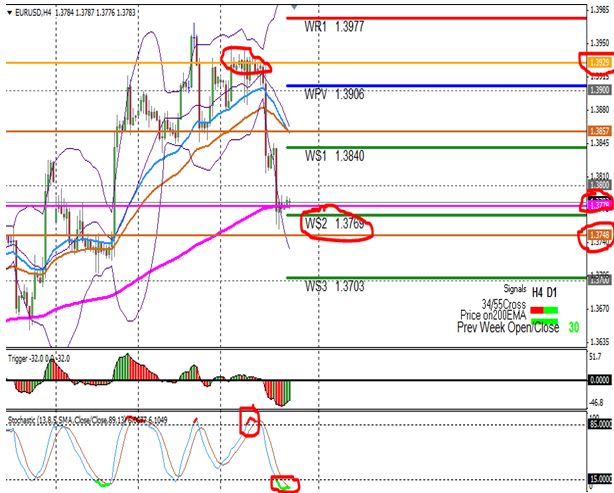
2) Euro/USD on the 4 hour chart:
Price is above the 200 EMA
34 EMA (sky) is above the 55 EMA (earth)
Direction: Long
Potential trading zone: 1.3902 to 1.3868
Potential area to look for reaction: The 1.3900 and 1.3868 levels.
Potential Profit take areas: The 1.3950 and 1.3977 levels.
MACDEE Divergence: No
Stochastic: No man’s land
Did we open with a GAP? No
Potential Counter Trades: The 1.3950 and 1.3977 levels.
Potential Profit takes areas: The 1.3906 level.
Notes: Yesterday price dropped into our zone and found support at the 34 EMA at the 62.5 fib where after we had a jump of 50 pips. I am a little concerned with longs on this pair as that orange line on my chart is the 1.3929 level……a Monthly pivot point area.
Looking at the DAILY chart we can clearly see MACDEE divergence showing up with an overbought stochastic….so all tell tell signs we might have a bigger pullback on the cards here mates. So take care!!
Fridays notes:
Give that man a beer!! 🙂
How right he was again 🙂 The MACDEE Divergence played out and price did find resistance at that monthly pivot I mentioned at 1.3929.
Price followed the Euro Index and dropped like a stone from 10 000 feet straight to the mother in law (200ema in pink) at 1.3776 giving us a cool 150 odd pips in the bank!! Currently we are sitting at the mother in laws kitchen table at 1.3776 with a weekly pivot just under this level and just under that – the daily 55 EMA plus stochastic is overbought so I think this will turn out to be support for now.
……………………………………………………………………………………………..
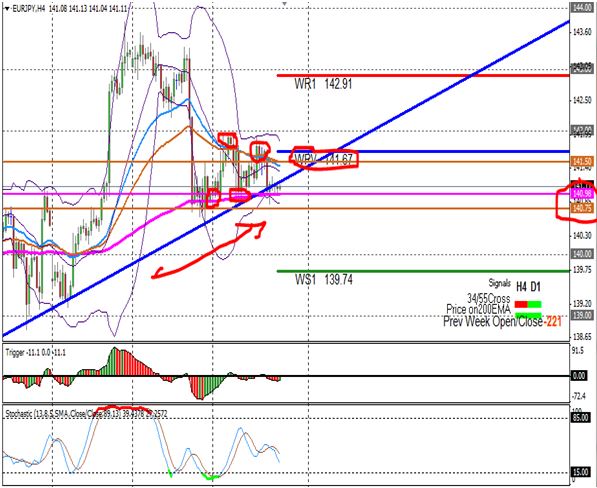
3) Euro/JPY on the 4 hour chart:
Notes: Early bird catches the worm they say….I see some of you took longs yesterday from the mother in law at the psychological level at 141.00 back up to 141.67 where we have the weekly main pivot ……..well done mates.
This morning we can see how the 142.00 level pushed price down again. Last week we closed min 221 pips lower than the opening price…..so that was a big move……..however, the 34/55 are only closing up now for the cross. I will be sitting a little on my hands with this pair as we can see on the Daily chart we are in a possible triangle with the bottom trend line once again at the psychological level of 141.00 where we also have the 4 hour 200 EMA waiting. This might be an area to look for longs again but be careful.
Fridays notes:
Give that man a rum !! 🙂
Early in the week some of you made pips with a long from the mother in law level at 141.00. Price got to the main weekly pivot but found resistance and move back again. This is where I mentioned to look for possible support once again at the 141.00 level as we had the daily bull trend line in the area plus mother in law EMA and daily 55 just under it. Price did exactly that and moved back up to the 141.70 level where we had the main weekly pivot point giving us once again 70 pips of profit.
……………………………………………………………………………………………..
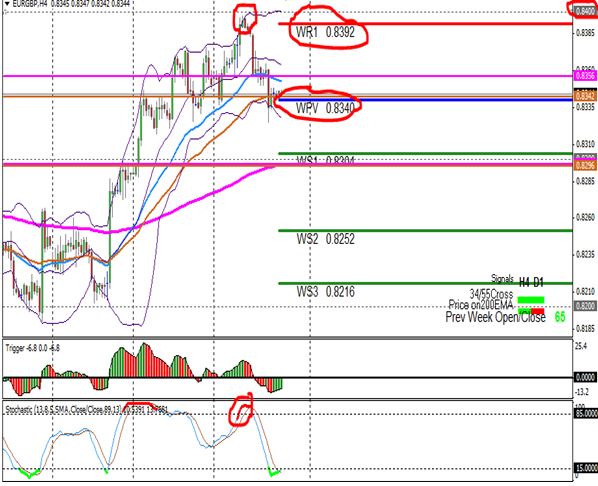
4) Euro/GBP on the 4 hour chart:
Notes: I am sitting on my hands with this pair as price is ignoring the Daily 200 EMA at 0.8356. Looks like we might be in an ascending triangle with the top at 0.8375…..so be careful.
Fridays notes:
Give than man a glass of water. 🙁
Price didn’t do what I was expected with the ascending triangle I mentioned. Instead we found resistance at the WR 1 pivot at 0.8392 before price went south again. Looking back this morning – it was an easy counter trade as this pair followed the Euro Index and Euro/Dollar this week. Remember it makes out the basket pairs. Price dropped 50 odd pips back to – drum roll please – the main weekly pivot at 0.8340!!
……………………………………………………………………………………………..
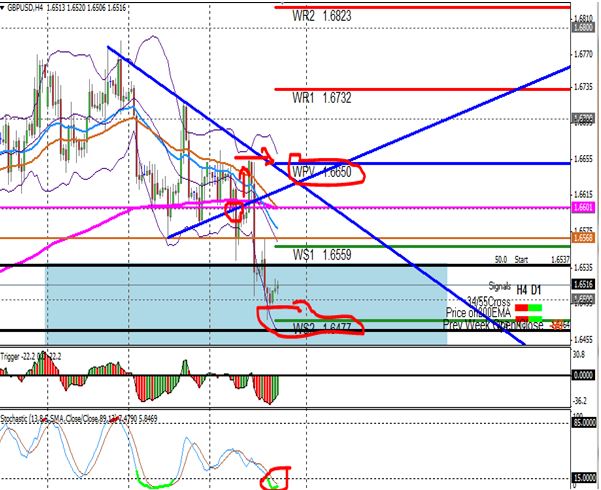
5) GBP/USD on the DAILY chart:
The 4 hour 34/55 EMA`S are all mixed up on the direction Indi……drop to the daily chart.
Price is above the 200 EMA
34 EMA (sky) is above the 55 EMA (earth)
Direction: Long
Potential trading zone: 1.6537 to 1.6394
Potential area to look for reaction: 1.6607 (38.2 fib) and weekly main pivot and 4 hour 200 EMA
Potential Profit take areas: The 1.6700/32 and 1.6785 levels
Stochastic: Getting in to oversold
MACDEE Divergence: No
Did we open with a GAP? No
Potential Counter Trades: The 1.6732 level.
Potential Profit take areas: The 1.6650 level.
Notes: I am sitting on my hands a little with this pair as it looks like we are ranging between 1.6800 and 1.6600.
Fridays notes:
Give that man a glass of water 🙁
Price on this pair was a bit naughty this week on the 4 hour chart. We had a triangle on this time frame. Price broke the triangle to the downside and broke also the 200 EMA to the down side and everybody were thinking here we go……..price gave the triangle and the mother in law the middle finger and retraced back into the triangle back up to the weekly main pivot at 1.6650. Once we got here the mid week red flag news came out and what happened……Price dropped 170 pips. Currently we are in the daily chart trading zone with price finding support at the weekly 2nd pivot at 1.6477 area. This will be next week’s problem as we have a roadblock now at 1.6568 and 1.6600 with possible longs.
……………………………………………………………………………………………..
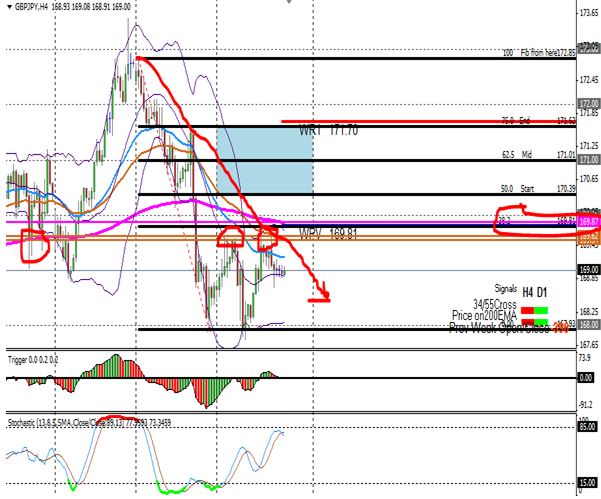
6) GBP/JPY on the 4 hour chart:
Price is under the 200 EMA
34 EMA (sky) is under the 55 EMA (earth)
Direction: Short
Potential trading zone: 170.39 to 171.62
Potential area to look for reaction: The 169.70/81 levels (38.2 fib) and 170.00
Potential Profit take areas: The 167.93 level
Stochastic: No man`s land
MACDEE Divergence: No
Did we open with a GAP? No
Potential Counter Trades: The 168.00 and 167.00 levels.
Potential Profit take areas: The 169.81 level.
Notes: Take note this week of the 38.2 fib level at 169.81 as we have a roadblock here in the form of loads of EMA`S and weekly main pivot.
Fridays notes:
Give that man a vodka 🙂
As I have mentioned – the 38.2 fib was key this week on this pair. Price proved me right and found resistance at this fib level and early in the week and dropped all the way to last week’s low at 168.00 where we found support again. This trade gave us 150 odd pips in the bank. Later on in the week price pulled back one again to the 38.2 fib and now holding hands with that level at 169.62 was the 55 EMA. This gave another opportunity for a short…..this trade is currently 60 odd pips up in the green.
……………………………………………………………………………………………..
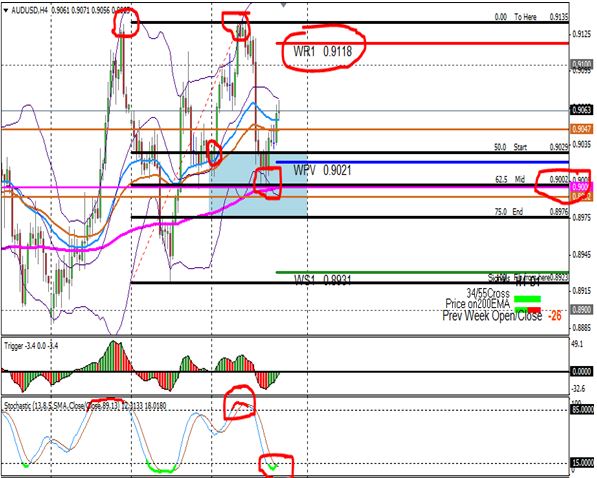
7) AUD/Dollar on the 4hour chart:
This trade already fired yesterday and I think some of you got onto this bus……well done! Price found support yesterday at the 50% fib and WEEKLY MAIN PIVOT at 0.9018. This pair also gave a nice clean trend line break on the 30 min chart and raced all the way to the profit take area giving us almost 100 pips.
Take note how we closed last week min.26 pips lower than last week’s opening……BUT THE 34/55 EMA`S WERE STILL STACK TO LOOK FOR LONGS THIS WEEK so we fib from last week’s low to last week’s high to get the earth and sky zone.
Price is above the 200 EMA
34 EMA (sky) is above the 55 EMA (earth)
Direction: Long
Potential trading zone: 0.9018 to 0.8971
Potential area to look for reaction: The 0.9030/18 and 0.9000 levels.
Potential Profit take areas: The 0.9100 and 0.9118 levels.
Stochastic: No man’s land
MACDEE Divergence: No
Did we open with a GAP? No
Potential Counter Trades: The 0.9100 and 0.9118 levels.
Potential Profit take areas: The 0.9021 level.
Notes: We have loads of EMA`S starting this week at the 38.2 fib at 0.8946 plus this is also the weekly main pivot.
Fridays notes:
Give that man a double brandy and coke 🙂 🙂
Price made a new high early in the week so we had to follow it with our fib to get the new potential trading zone for the week. I mentioned the 0.9118 level as a counter trade area. We got the entry and we had a nice clean run all the way to our preferred profit take area at 0.9021……giving us almost 100 pips.
The second part came when we found support at the mother in law in the trading zone where a long position was setting up. This trade is currently 57 pips up in the green.

……………………………………………………………………………………………..
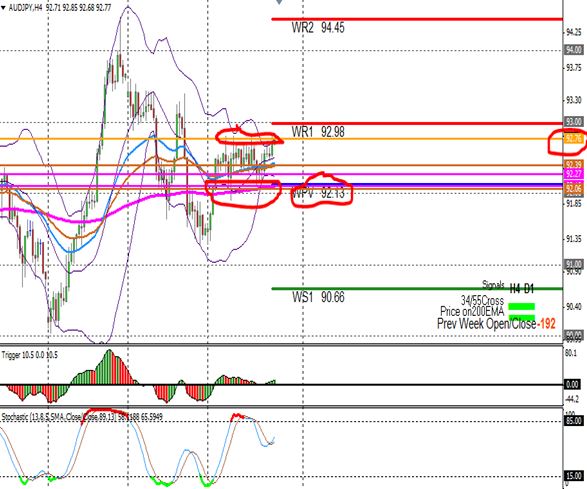
8) AUD/JPY on the 4 hour chart:
Notes: The 34/55 EMA`S are mixed on the direction Indi. Price is trapped in a triangle and I don’t like the way how we break the 200 EMA`S like the don’t exist!!! Think there are far better charts out there this week than this one.
Fridays notes:
Give that man a glass of white wine 🙂
Price was bouncing this week of the main weekly pivot at 92.13 giving 60 pips and the pullback once again back to the 92.13 level. There was just not enough momentum/volume to break the 92.77 level this week……so as I have said…..there were better opportunities ells where.
…………………………………………………………………………………………….
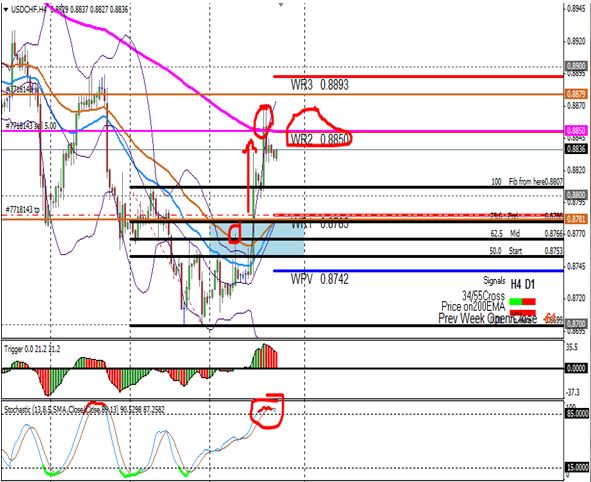
9) USD/CHF on the 4 hour chart:
Price is under the 200 EMA
34 EMA (sky) is under the 55 EMA (earth)
Direction: Short
Potential trading zone: 0.8753 to 0.8780
Potential area to look for reaction: The 0.8768 level.
Potential Profit take areas: The 0.8700 and 0.8681/77 levels.
Stochastic: No man`s land
MACDEE Divergence: YES !!!!!!!!!!!!!!!!!!!!!!!!!!!!!!!!!!!!!!!!!!!!!!!!!!!!!!!!!
Did we open with a GAP? No
Potential Counter Trades: The 0.8700 and 0.8681/77 levels.
Potential Profit take areas: The 0.8742 level.
Notes: Take note of the MACDEE divergence plus the monthly pivot at 0.8681 as a possible bottom.
Fridays notes:
Give that man a glass of water 🙂
Price did come into the potential trading zone early in the week and touched the 55 EMA at 0.8766 before we had a 30 pip drop. Mid weeks red flag news made this pair jump the trading zone and we raced south like there was no tomorrow. But by now you know your fat mother in law is a woman that can stop moves like this and add to that a WR2 pivot then that is a force to look out for. Price stopped dead in its tracks at this level where a possible short is on the cards!!
……………………………………………………………………………………………..
10) USD/JPY on the 4 hour chart:
Price is under the 200 EMA
34 EMA (sky) is under the 55 EMA (earth)
Direction: Short
Potential trading zone: 102.32 to 102.88
Potential area to look for reaction: The 102.20 and 102.38 levels.
Potential Profit take areas: The 101.20 and 101.00 and 100.67 levels.
Stochastic: No man’s land
MACDEE Divergence: No
Did we open with a GAP? No
Potential Counter Trades: The 101.20 and 101.00 and 100.67 levels.
Potential Profit take areas: The 102.00 level.
Notes: Bollinger band is closing up.
Fridays notes:
Give that man a glass of red wine 🙂
With the red flag news this week…..price shot up all the way to the mother in law at 102.32 where we are hitting the brakes at the moment with a stochastic that is overbought. So keep your eyes open for a possible short.

……………………………………………………………………………………………..
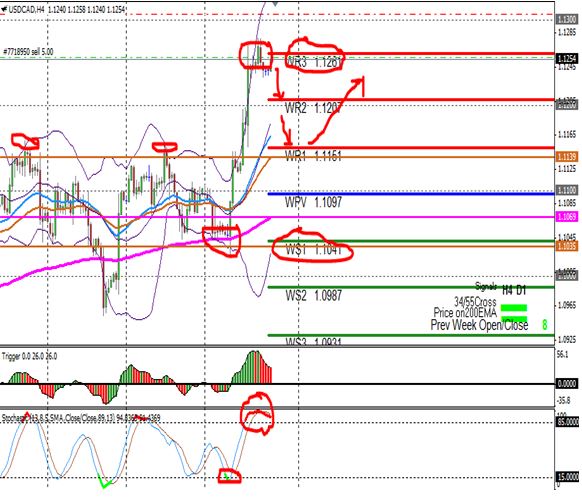
11) USD/CAD on the DAILY chart:
Notes: If we look at the daily chart on this pair then we still trapped in that triangle. Till this triangle breaks – I will be sitting on my hands.
Fridays notes.
I missed the one totally 🙁
Some of my mates used the 4 hour chart on this pair and we found some good support at the WS1 pivot and 200 EMA and daily 55 EMA waiting at 1.1041. From here on there was no stopping this pair as it broke every record on its way blasting pivot points long they way if they were non existing – even the prev.1.200 big resistance didn’t hold……….by the looks of it we might have a bit of resistance now here at the WR3 pivot at 1.1261 this morning…….but be careful as momentum/volume is behind this pair at the moment.
……………………………………………………………………………………………..
12) USD Index on the 4 hour chart:
Price is under the 200 EMA
34 EMA (sky) is under the 55 EMA (earth)
Direction: Short
Potential trading zone: 79.60 to 79.78
Potential area to look for reaction: The 79.60 and 79.78 levels
Potential Profit takes areas: The 79.24 and 79.17 and 79.10 levels.
Stochastic: No man’s land
MACDEE Divergence: YES !!!!!!!!!!!!!!!!!!!!!!!!!!!!!!!!!!!!!!!!!!!!!!!
Did we open with a GAP? No
Potential Counter Trades: The 79.24/17/10 levels.
Potential Profit take areas: The 79.53 level.
Notes: Take note of the MACDEE divergence and the monthly pivot at 79.17 (orange line on chart) This can be a BIG support level taking the info we got on the Euro Index also in consideration.
Fridays notes:
Give that man a bottle of rum for the weekend 🙂 🙂 🙂
I warned you that we have MACDEE divergence and that support level at 79.17. We came within 7 pips from this level…..where after price shot up from here right past the 4 hour trading zone with the red flag news driving it. I warned you about the negative correlation between this pair and the Euro Index. This was a perfect example of how it helps to use these two indexes to trade the 10 pairs Marc and I look at. We might overshoot the trading zone….but we right in the daily chart earth and sky zone ………….so it will be an exciting week next week.

Well I think I deserve one ………….
Prost !!!!!!!!
Pierre Du Plessis 😛
If you would like to learn how to trade successfully check out our
5* rated, low cost Forex Mentor Porgram
0 Comments